Analytics Dashboard
See the full picture with analytics dashboards
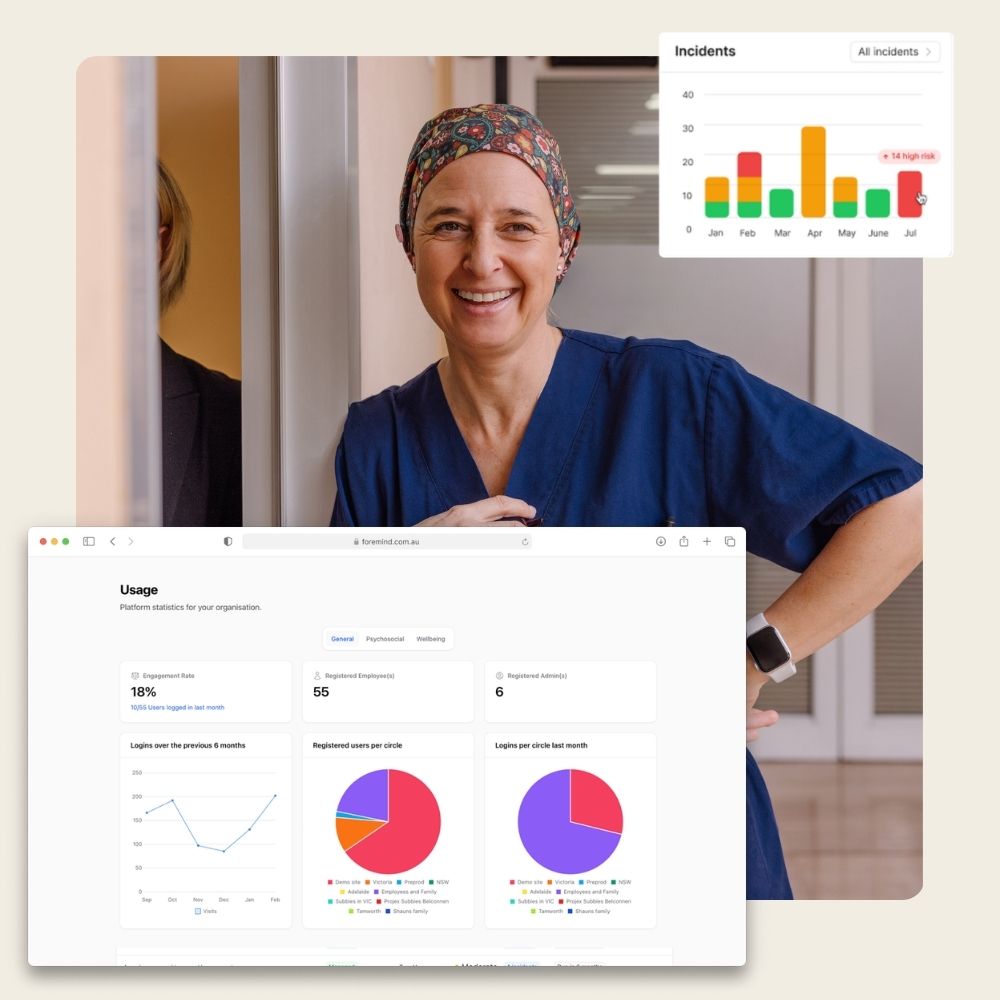
Check-ins, incidents, counselling usage and risk assessments - connected. See the full picture of psychosocial safety in one dashboard.
Trusted by Hundreds of Leading Australian Businesses







See data & patterns you can act on
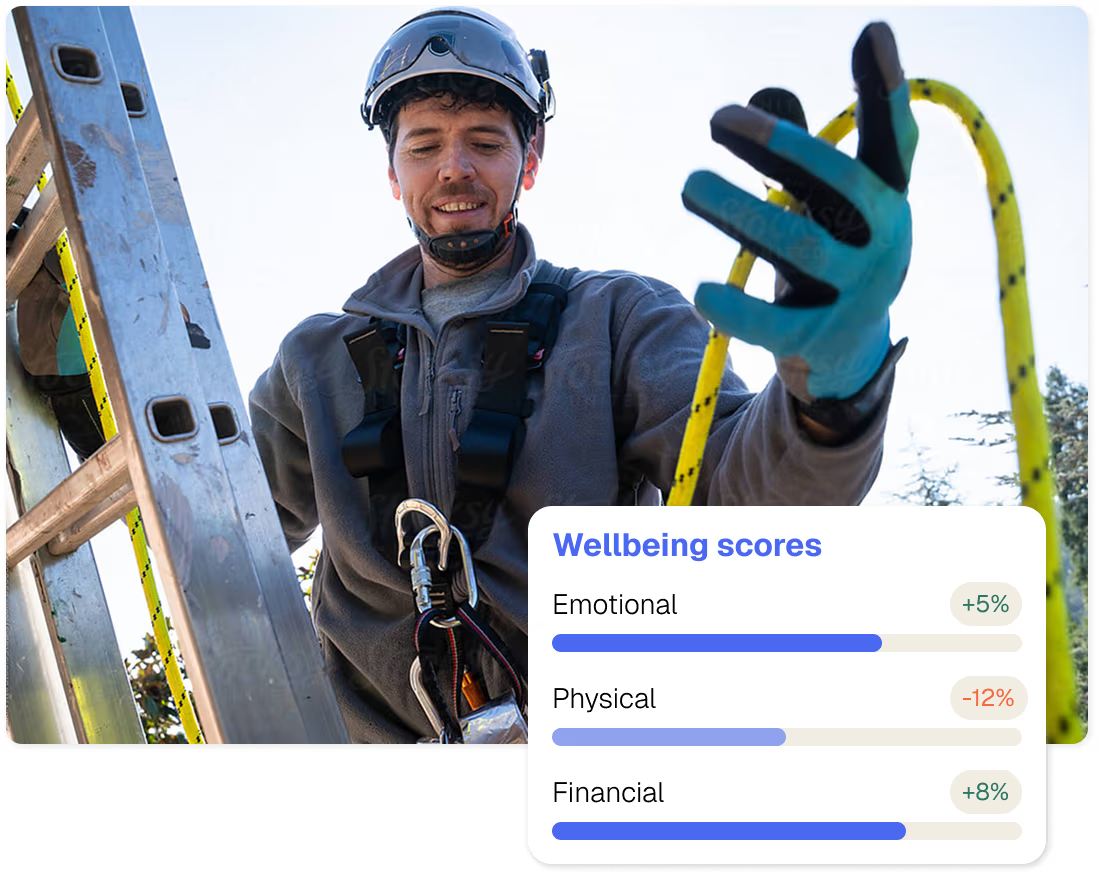
Most psychosocial risk stays invisible because the data that would reveal it lives in separate places.
Foremind connects it - check-ins, incidents, session topics and risk assessments - broken down by team, site or department.
Check-ins flagging elevated distress. Incidents clustering around one team. Session bookings spiking after a roster change.
ROI data, always available

Know if your rollout is working by seeing total registered users, login activity and invitation data at a glance.
See whether staff are actually engaging with the platform from the first week - not twelve months later in a summary report.
No gut feel, no chasing updates. A clear picture from day one.
Client testimonials

Deborah Lockart
Manager of Risk & Compliance RHM Consultants
It is an absolute win for our industry that Foremind are advocating, leading and delivering a much needed service. What is even better is that they do it meaningfully and with passion

Chris Morgan
General Manager, People & Culture, Morcare Services Pty. Ltd.
We've been with Foremind a little over 12 months and our experience has been excellent. The feedback from our employees who use the platform and counselling services has been positive, and the Foremind team are easy to deal with and very accommodating of requests.
Bebhinn Forde
Max Build, Head of People and Culture
I've been using Foremind as the EAP provider for +3 years now and have had a really positive experience. While they may be a smaller player compared to some of the larger global providers, the quality of service is absolutely comparable. The platform is intuitive, the support offering is strong, and the overall experience for employees has been consistently positive.

Jill Brown
Chief Executive Officer, LGPro VIC
We've had a very positive experience working with Foremind as our Employee Assistance Program provider. The platform is easy to navigate, onboarding was smooth, and the team is responsive and supportive. The addition of holistic services has strengthened the offering and provides meaningful, practical support for our staff.

Janelle D'Arcy
Head of People & Culture, WBP Group
A modern & proactive view of mental health exists that is refreshing to see. Great resources exist on their platform & informative & practical webinars are offered that always hit the mark. Also, easy to deal with in a way that feels like a partnership not a provider/client relationship.

Kim Bush
Director of Workforce and Culture, Beaufort & Skipton Health Service
Foremind provides comprehensive and easy access for our team. The volume and scope of resources is exceptional and booking a session is inviting for those who need it.
Jo Livingston
Indesco HR Manager
Foremind provides a very personal, responsive service and has a wide range of resources available to support our employees. The personal approach Joel and the team add shows they understand the industry and best ways to support workers inside of it.

Fiona Harrop
Director of Operations & Transformation, UnLtd
Foremind has been easy to navigate, both for our team and from an admin perspective. It's simple to onboard new team members quickly and efficientl. Those who have used the platform have been very positive - calling out how useful it is and how easy it is to access and engage with the support available.

Georgina Byron
CEO at The Snow Foundation
Foremind’s work is inspirational. We are all interested in improving positive mindsets and wellbeing.. and workers don’t always have the opportunity to have that wellbeing check in. There’s not that culture of putting your hand up and saying you’re not okay.
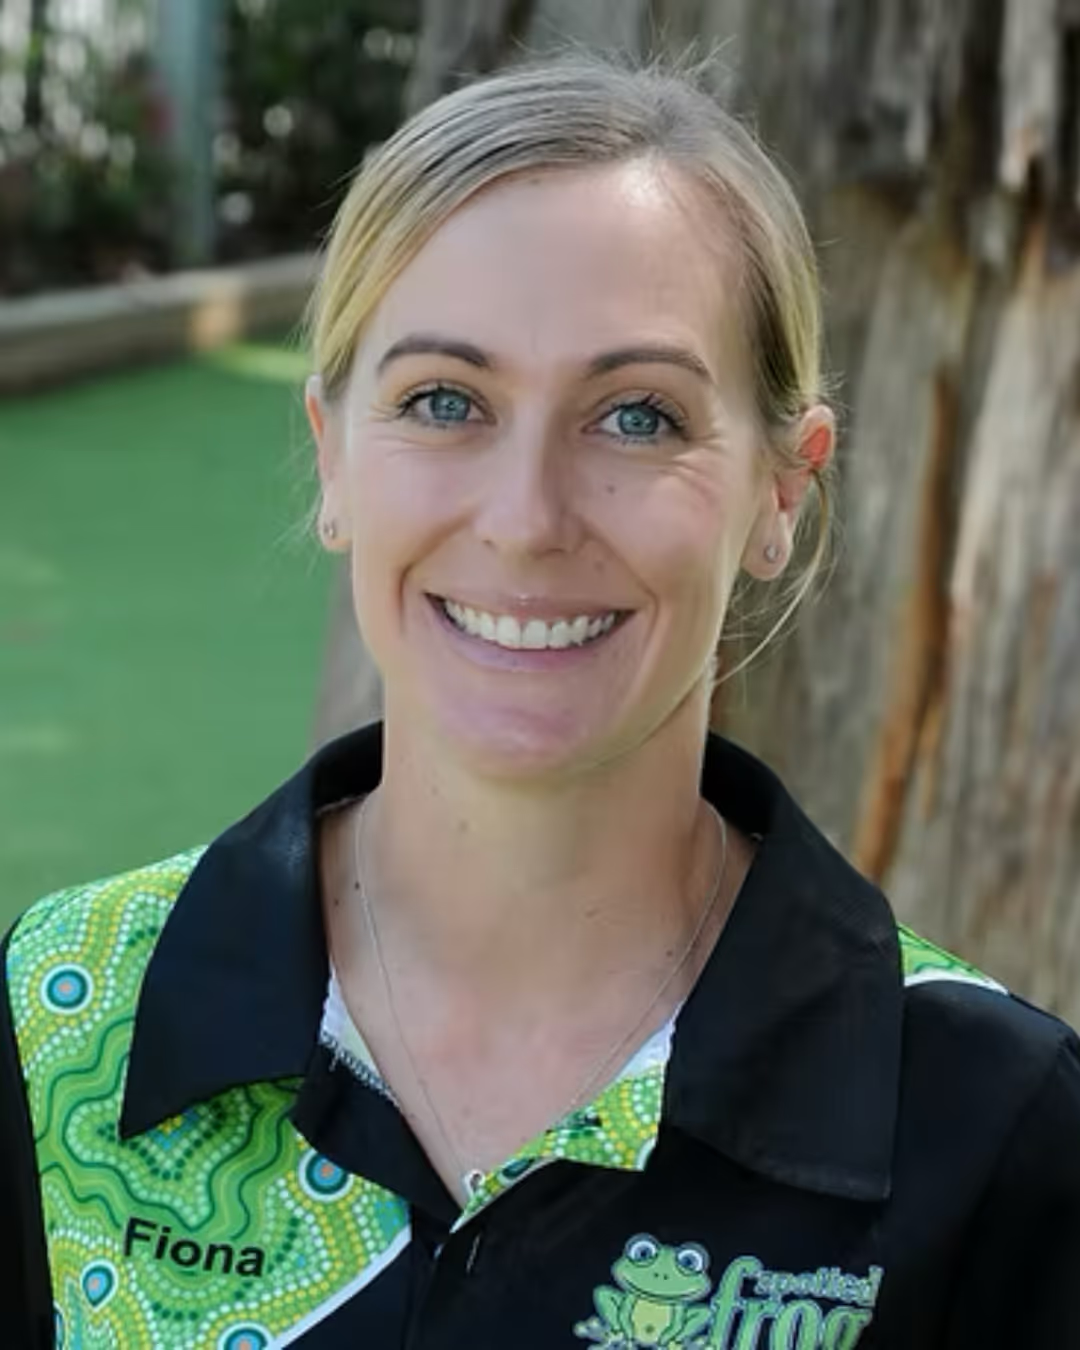
Fiona Parson
Owner, Spotted Frog Kindergarten
I've noticed that the team's morale has been at an all-time high this year, and I think a lot of that has come from having a service like Foremind in place.

Phil Cameron
Area Environmental Managing Director
Ive been able to visibly notice a change in energy and productivity in the office since engaging Foremind, the onboarding and initial training were so fantastic we decided to do it quarterly.
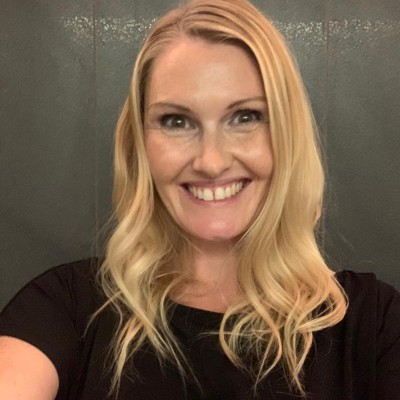
Abbey Suter
Business Owner, Acacia Ridge Pet Resort
We have worked with foremind for 12 months to assist in supporting our staff and it's been an asset for our business. Recommended resource!

Natasha Tufenkjian
HR Manager, Fighting Chance
The counselling service has been amazing, and our employees have been super impressed by their sessions

George Chukwukezie
HR Manager, Vacenti
Having the ability to provide support for our staff has been really beneficial. The feedback we always hear is how easy it is to book a session. They can go in, look at who is available and book it in quickly. It's been really great.

It is an absolute win for our industry that Foremind are advocating, leading and delivering a much needed service. What is even better is that they do it meaningfully and with passion
We've been with Foremind a little over 12 months and our experience has been excellent. The feedback from our employees who use the platform and counselling services has been positive, and the Foremind team are easy to deal with and very accommodating of requests.
I've been using Foremind as the EAP provider for +3 years now and have had a really positive experience. While they may be a smaller player compared to some of the larger global providers, the quality of service is absolutely comparable. The platform is intuitive, the support offering is strong, and the overall experience for employees has been consistently positive.
We've had a very positive experience working with Foremind as our Employee Assistance Program provider. The platform is easy to navigate, onboarding was smooth, and the team is responsive and supportive. The addition of holistic services has strengthened the offering and provides meaningful, practical support for our staff.
A modern & proactive view of mental health exists that is refreshing to see. Great resources exist on their platform & informative & practical webinars are offered that always hit the mark. Also, easy to deal with in a way that feels like a partnership not a provider/client relationship.
Foremind provides comprehensive and easy access for our team. The volume and scope of resources is exceptional and booking a session is inviting for those who need it.
Foremind provides a very personal, responsive service and has a wide range of resources available to support our employees. The personal approach Joel and the team add shows they understand the industry and best ways to support workers inside of it.
Foremind has been easy to navigate, both for our team and from an admin perspective. It's simple to onboard new team members quickly and efficientl. Those who have used the platform have been very positive - calling out how useful it is and how easy it is to access and engage with the support available.
Foremind’s work is inspirational. We are all interested in improving positive mindsets and wellbeing.. and workers don’t always have the opportunity to have that wellbeing check in. There’s not that culture of putting your hand up and saying you’re not okay.
I've noticed that the team's morale has been at an all-time high this year, and I think a lot of that has come from having a service like Foremind in place.
Ive been able to visibly notice a change in energy and productivity in the office since engaging Foremind, the onboarding and initial training were so fantastic we decided to do it quarterly.
We have worked with foremind for 12 months to assist in supporting our staff and it's been an asset for our business. Recommended resource!
The counselling service has been amazing, and our employees have been super impressed by their sessions
Having the ability to provide support for our staff has been really beneficial. The feedback we always hear is how easy it is to book a session. They can go in, look at who is available and book it in quickly. It's been really great.
Confidentiality protected, always
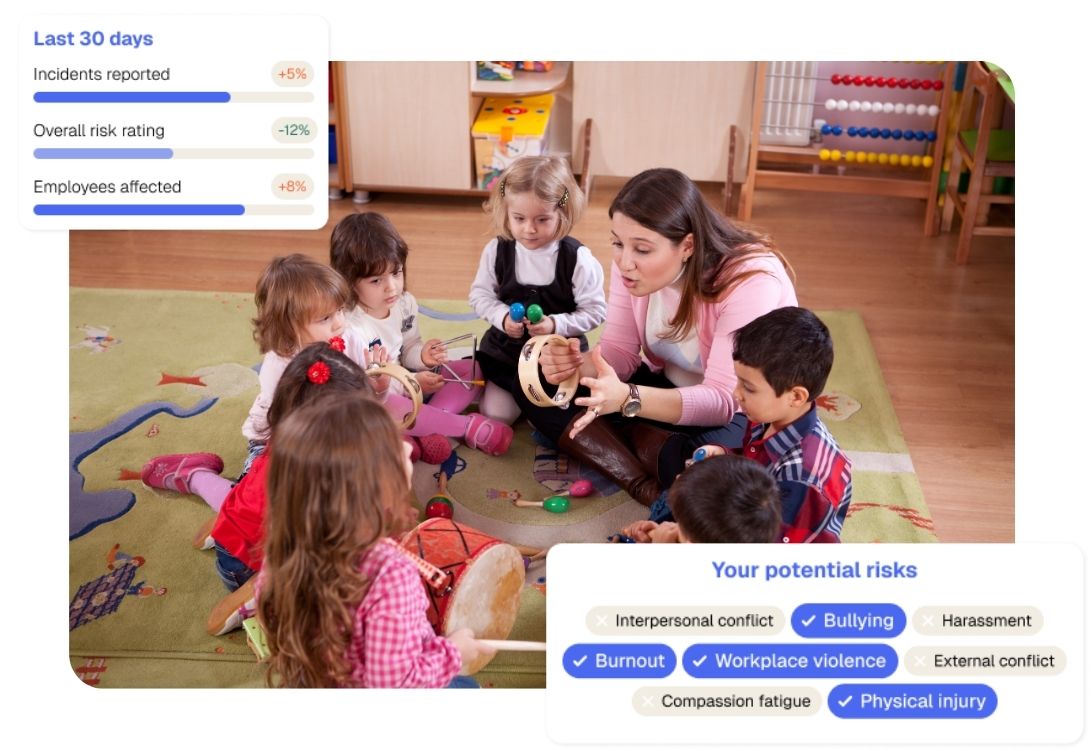
Confidentiality isn't a compliance box here.
If people think their manager might find out they booked a session, they won't book one, and you end up with a service nobody uses and no useful data either.
So the dashboard only ever shows trends. Individual details - who accessed what, and when - are never available to anyone in your organisation.
Data points are only surfaced once a group is large enough that nobody can be picked out of it.
Audit ready, board ready
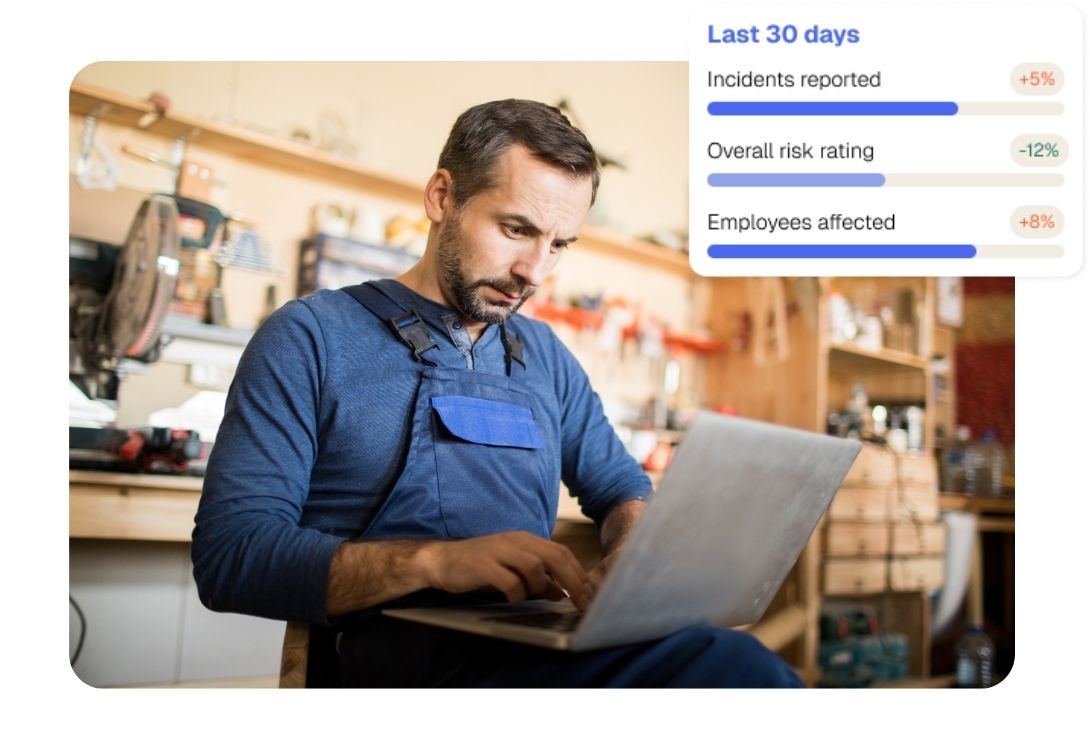
Everything the dashboard tracks can be exported, so the record of what you monitored and when is already there when someone asks for it.
That covers a WorkSafe request, a board paper, or an insurer wanting to see what you had in place before an incident.
The alternative is reconstructing a year of activity out of emails and spreadsheets, usually at the point where you have the least time for it.
See the pressure, before it's a crisis
Traditional EAP reporting arrives once a year and tells you how many sessions were used. Not where the pressure was.
Foremind connects check-ins, incidents, session topics and risk assessments in one view, broken down by team and site.
Lead indicators, not lag
Signals show up while you can still respond.
Segments, not averages
An org-wide figure hides the team that's struggling.
Trends only, always
No individual details, ever. Which is why people use it.
Answers to the frequently asked questions.
How is this different from the annual EAP utilisation report?+
Traditional EAPs send a PDF once a year showing how many sessions were used. Foremind's dashboard is live - broken down by team, updated in real time, and connected to check-ins, incidents, and risk assessments, not just session counts.
Can I see which specific teams are struggling, or just organisation-wide data?+
You can see data broken down by circle - the segments you define, whether that's by site, team, department, or shift. Organisation-wide averages often mask where the real pressure is building.
Can I export dashboard data for a WorkSafe audit or board report?+
Yes. Reports can be exported as PDFs - showing utilisation, incident trends, and risk assessments in a format that demonstrates documented duty of care. No manual assembly from spreadsheets required.
Can managers see who's booked a counselling session?+
No. Managers see how many sessions were booked across a team - never who booked them. Everything rolls up to team level: you get the visibility you need to manage risk, without the detail that breaks trust. Clinical data stays between the staff member and their counsellor. Full stop.
Got 20 mins to see if Foremind suits your site?

Not ready to talk? Fair play.
Download our one-pager to share with your team first.